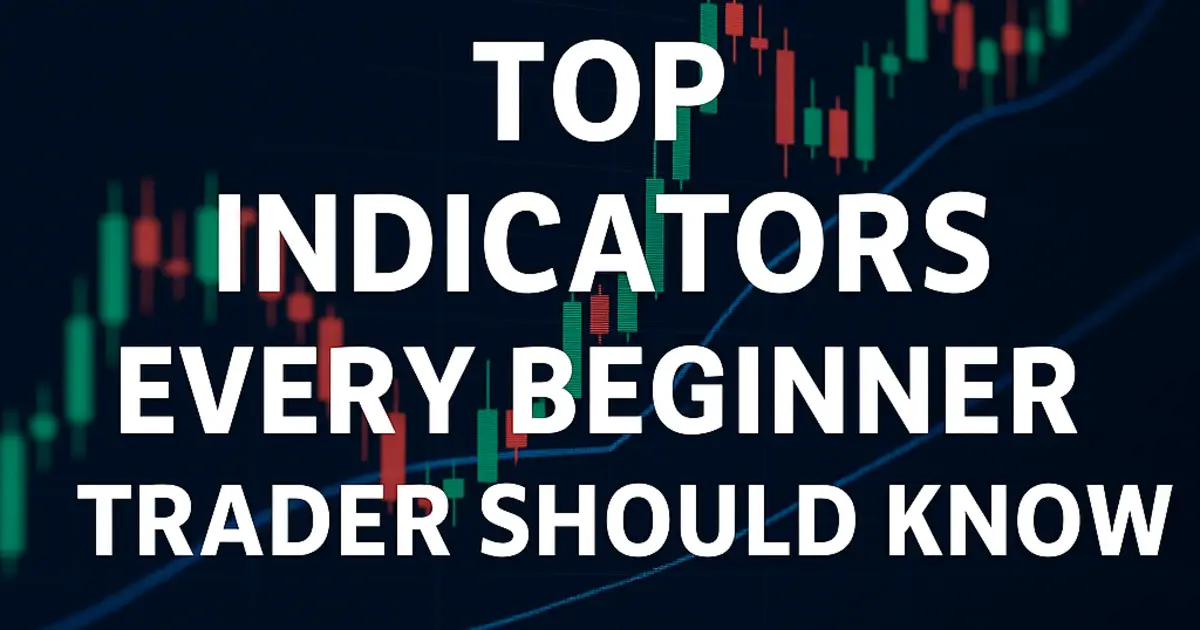
Starting your trading journey can feel overwhelming, especially with all the tools, terms, and charts thrown at you. But don’t worry—some indicators are beginner-friendly and incredibly useful in helping you make smart trading decisions. In this article, we’ll break down the top indicators every beginner trader should know, explained in plain English.
Moving Average (MA)
What it does:
The Moving Average smooths out price action over a specific time period. It helps you identify the general direction of the market (trend).
Why it matters:
When the price is above the moving average, it’s often considered an uptrend. When it’s below, it’s usually a downtrend. Simple and effective.
Pro tip:
Use both short-term (like the 20-day MA) and long-term (like the 200-day MA) to spot trend shifts.
Relative Strength Index (RSI)
What it does:
RSI measures the speed and change of price movements. It ranges from 0 to 100.
Why it matters:
RSI above 70 = overbought (price might drop soon)
RSI below 30 = oversold (price might rise soon)
Pro tip:
Look for RSI divergences—when price moves in the opposite direction of RSI, it often signals a trend reversal.
Moving Average Convergence Divergence
What it does:
MACD is a momentum indicator that shows the relationship between two moving averages (12 EMA and 26 EMA).
Why it matters:
It helps you understand if momentum is increasing or fading. A crossover between the MACD line and signal line can hint at a new trend starting.
Pro tip:
Combine MACD with RSI to confirm momentum and potential reversals.
Bollinger Bands
What it does:
Bollinger Bands consist of a moving average and two standard deviation lines—one above and one below.
Why it matters:
It shows whether the market is volatile or calm and whether prices are relatively high or low.
Pro tip:
When bands are tight, expect a breakout. When price hits the outer bands, it might bounce or reverse.
Volume
What it does:
Volume measures how many shares/contracts are being traded during a specific time.
Why it matters:
High volume = strong interest. Low volume = weak interest. Confirm trends with volume—strong moves should be backed by strong volume.
Pro tip:
Use volume spikes to confirm breakouts and breakdowns.
Stochastic Oscillator
What it does:
It compares a specific closing price to a range of prices over a period.
Why it matters:
It helps you identify overbought and oversold conditions.
Pro tip:
Look for %K and %D crossovers—they signal potential entry or exit points.
Support and Resistance Levels
What it does:
These aren’t indicators in the traditional sense but are essential. Support is a level where price tends to bounce up. Resistance is where price tends to fall back.
Why it matters:
They help you spot entry and exit zones, and manage risk effectively.
Pro tip:
Combine support/resistance zones with RSI or MACD for more reliable signals.
How to Use These Indicators Effectively
- Don’t rely on just one: Combine two or three for more accurate decisions.
- Practice on a demo account: Before risking real money, test strategies with these indicators.
- Keep it simple: Avoid cluttering your charts with too many tools.
Conclusion
Trading doesn’t have to be confusing. By focusing on these top indicators—Moving Average, RSI, MACD, Bollinger Bands, Volume, Stochastic Oscillator, and Support/Resistance—you’ll have a solid foundation. These tools won’t make you rich overnight, but they’ll help you trade smarter, not harder.